tldr: I built a “Pettai Rap basket” inflation tracker and compared it with official CPI and GDP growth.
I have wanted to build this for years.
My best friend and I have this party trick of being able to rap the cult tamil song Pettai Rap, to loud cheers and general merriment. Pettai Rap is a much loved mid 90s Tamil rap song about life and money and never having enough! Sounds familiar?

Many years ago, when we both frequently worked on macroeconomic ideas, we used to joke that the song deserved its own CPI basket. And even if it was an idle thought then, it was a sensible one, because while broad national inflation can be/feel moderate, specific household baskets that certain categories spend on, can be/feel expensive.
A few days ago, I saw on the news that the Government of India, Ministry of Statistics had released its datasets through an MCP. Instead of going hunting through the various APIs, I could now ask a coding agent to broadly match the goods from Pettai Rap to the CPI item codes and discuss the maths with me, and draw up up a Pettai Rap Basket of Goods. So I did.
Here it is.
The economics question
Official CPI is a weighted national basket. It is methodologically sound, but very broad.
The Pettai Rap basket is intentionally narrow and deeply, culturally, specific. Its also from a simpler time when we didn’t have all-prevalent internet, or even phones. This reason is exactly why it is useful as a lens to compare against CPI:
- PR captures a “felt inflation” story for lower and middle income daily spending.
- PR highlights concentration risk: when food/fuel-heavy baskets move, households feel pain faster.
- PR makes inflation communication more intuitive than abstract index points.
So this project asks a simple question: How does this lived subsistence basket behave relative to CPI over time?
What I built
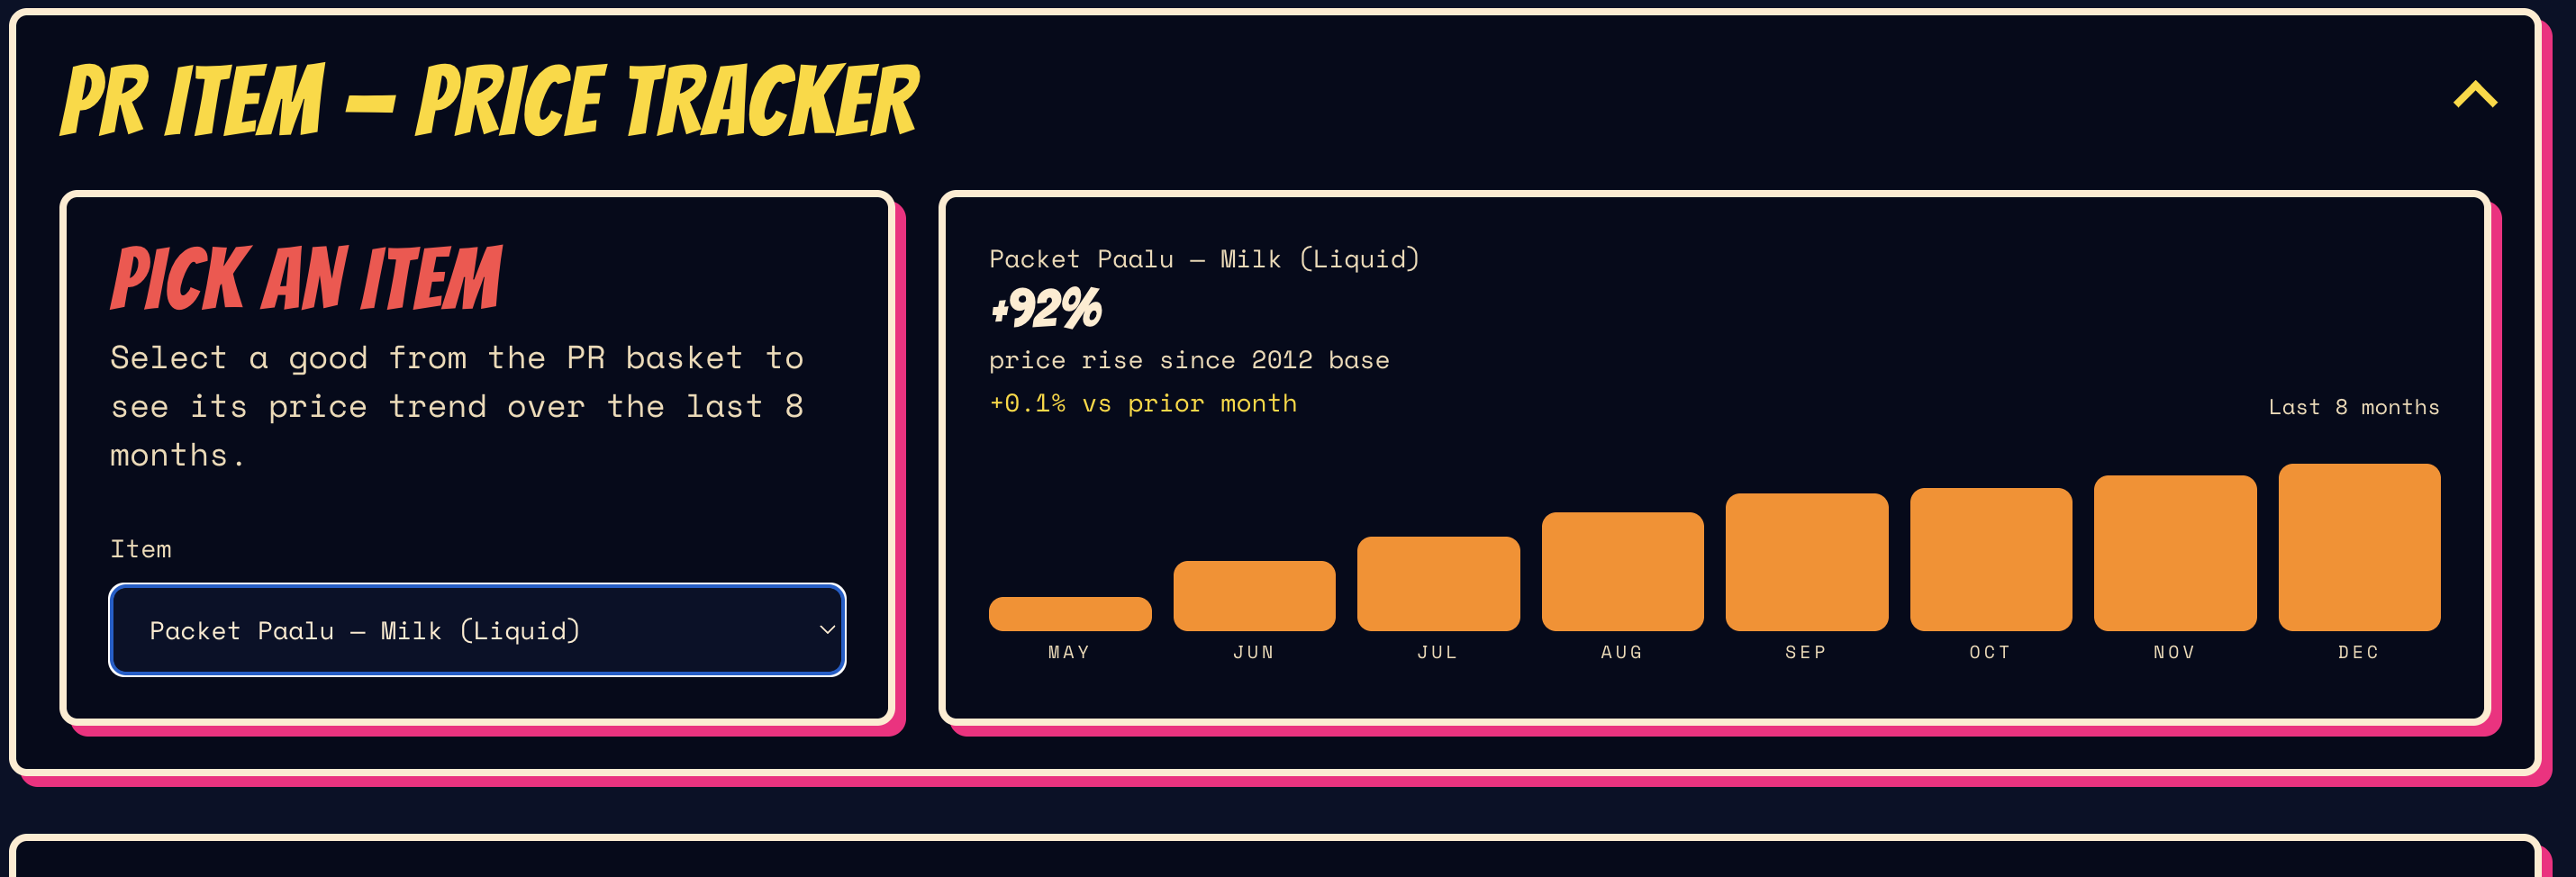
- A PR basket of goods - mapped from the lyrics to official CPI item series.
- A comparable CPI series for the same timeline.
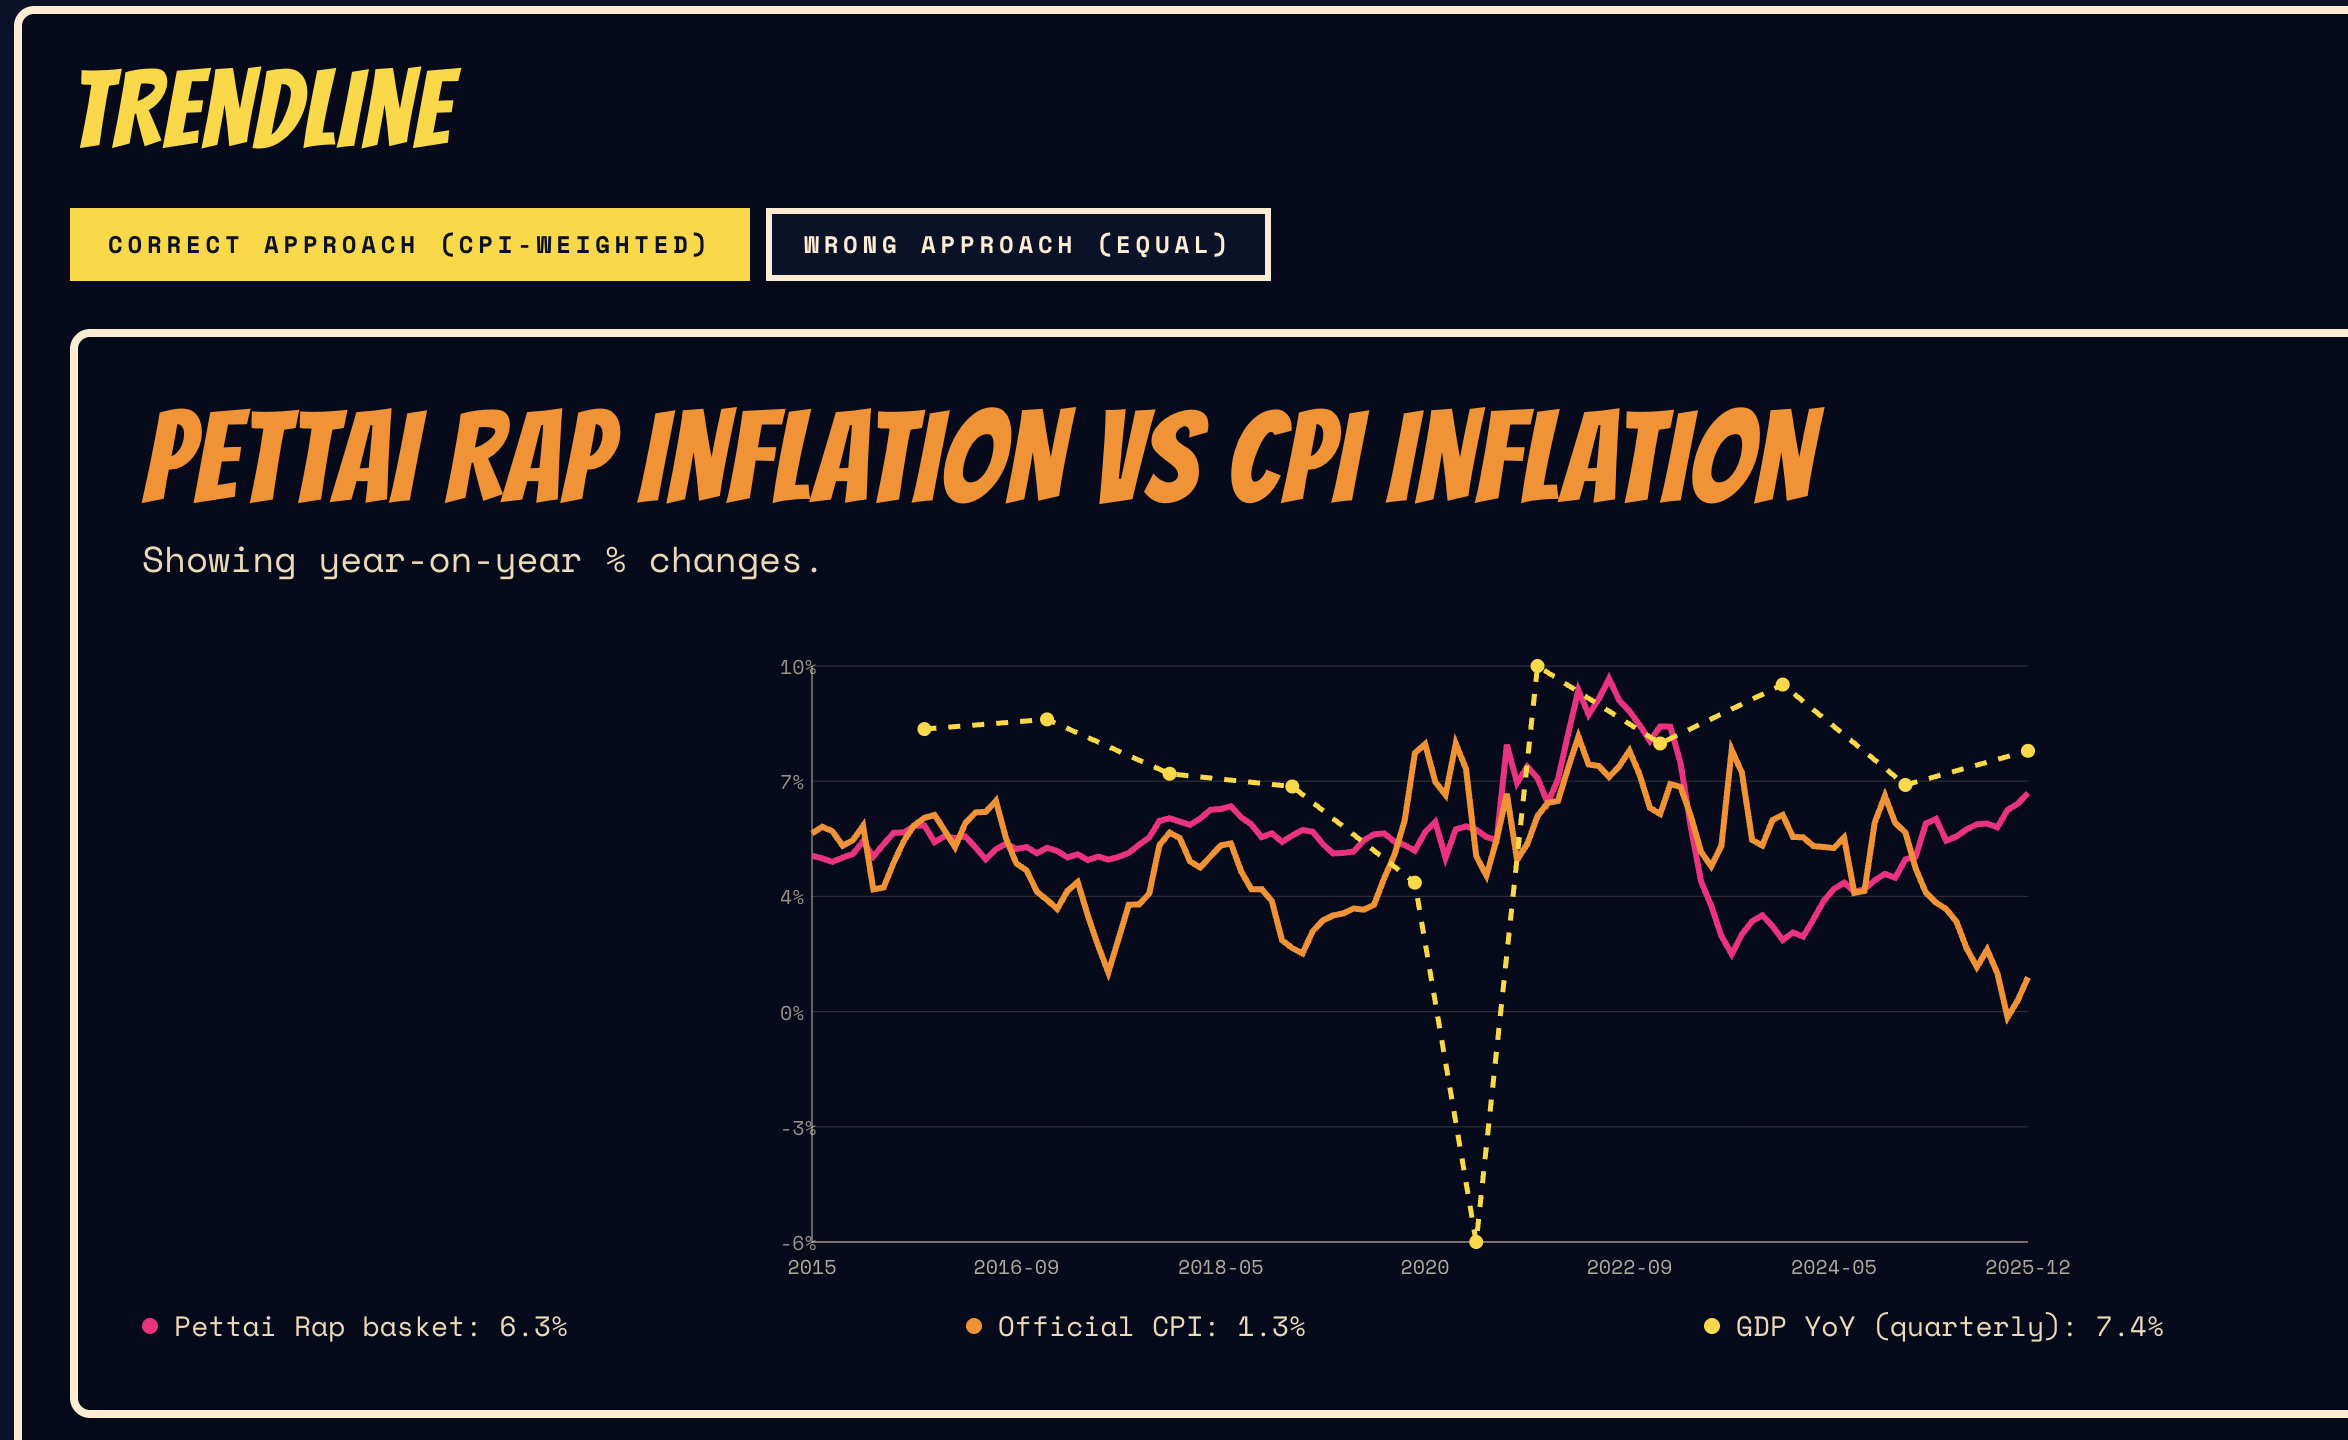
- YoY and MoM comparisons, plus cumulative movement from base year.
- A GDP YoY overlay
- A changelog-backed refresh workflow so updates are traceable. (this is erroring out as of Feb 12 - so I will fix it over the weekend).
Why MCP made this practical
Without MCP, stitching this together is tedious:
- discover correct datasets, item codes/group codes.
- Manually update the analysis even if the data-gathering can be automated a APIs and webhooks.
MCP reduced that friction materially - and the gamechanger here is building an agent that will call for the data on certain dates, analyse it and write the takeaway and the analysis month on month - to keep it curent.
Why this matters to me
Sometimes you dream of building something for years, and then an AI model upgrade and a bit of free time makes it magically come together - this was that moment for me.